
If you are an Instagram user, at some point, you care going to be interested in the various metrics such as followers, number of posts by a certain user etc. You might want to compare these metrics between different users or to find out the number of posts with a certain hashtag etc. The casual way to do it is to go the relevant Instagram page and look at the metric and write it down somewhere, and go to next and so on. Clearly this is not ideal strategy if you want to look at a few hundred pages. It would be neat to get this data in an automated manner.
The Instagram API exists to allow automated access to underlying data. The R package instaR is based on this idea. You can go make a developer account and after all the hassle, what you get is only data from your own account. You do not really get information about any other internal metrics or publicly available information. Why publicly available info is not available through the API is perplexing. You can go these pages and write down this information, but it cannot be made available programmatically. One possible explanation is that Instagram has restricted this information because it wants users to buy this information or rely on 3rd party tools (who in turn pays Instagram). Income from ADs, and internal data is not good enough that they have to sell public data as well.
So the only option we are left with is web scraping or crawling or whatever it is called. I used the httr package to get the webpage and then do some string matching using grep and stringr to extract the information I am looking for. I packaged the code into a little R package here.
In this example, I am exploring which hashtags to use for my aerial/drone photographs and how to pick them in a non-random informed manner. I have picked some usernames/accounts in the aerial/drone category with curated user content to collect some data. I have picked usernames that use the same hashtag.
# a vector of valid username/hashtags
names <- c("abstractaerialart", "aerial_aesthetics", "all_things_drone",
"aworldfromabove", "discovererdrone", "drnland", "drohnengeek", "drone_feed",
"dronedesire", "dronefluence", "dronefly", "dronelads", "dronenature",
"droneofficials", "dronepals", "dronephotooftheday", "dronephotosdaily",
"dronewise", "flyresponsibly", "fromwhereidrone", "gameofdronez",
"guidetodrone", "hypepools", "igdroneshots", "instadroned", "mavicimages",
"nordicsfromabove", "top_drones", "topdroneshots", "twenty4sevendrones",
"worlddroneshots", "amzdronepics")
And then I run the loop below with functions from iscrape to collect the data.
library(iscrape)

len <- length(names)
klist <- vector("list", length=len)
for(i in 1:len)
{
  cat(paste0("\nRunning ", i, " of ", len, "; ", names[i], "; "))
  pu <- get_page_user(names[i])
  pcount <- get_count_post(pu)
  cat(pcount, " ")
  fcount <- get_count_follower(pu)
  cat(fcount, " ")
  focount <- get_count_following(pu)
  cat(focount, "; ")

  ph <- get_page_hashtag(names[i])
  hcount <- get_count_hashtag(ph)
  cat(hcount, ";")

  klist[[i]] <- data.frame(name=names[i], posts=pcount, followers=fcount, following=focount,hashtagcounts=hcount, stringsAsFactors=F)

  # variation in timing page request
  Sys.sleep(sample(1:6, 1, replace=T))
}

dfr <- dplyr::bind_rows(klist)
Now, we have a data frame with user names, post count, follower count, following count and hashtag counts.
> head(dfr)
                name posts followers following hashtagcounts
1 abstractaerialart   179      3955       978          1366
2 aerial_aesthetics   749     47300      5910         12700
3  all_things_drone   642     24500      1943           597
4   aworldfromabove   172      4155        36           495
5   discovererdrone   170     59400      1852          7997
6           drnland   386     18800      1242         11900
The data is plotted out as interactive scatterplot using R package highcharter.
library(highcharter)

hchart(dfr, "bubble", hcaes(x=followers, y=hashtagcounts, size=posts)) %>%
  hc_xAxis(type="logarithmic", title=list(text="Subscribers"), crosshair=TRUE) %>%
  hc_yAxis(type="logarithmic", title=list(text="Hastag Count"), crosshair=TRUE) %>%
  hc_chart(zoomType="xy") %>%
  hc_tooltip(useHTML=TRUE, positioner=list(list(x=0, y=0)),
              formatter = JS("function(){
                            return('<br><b>Hashtag: </b>'+this.point.name+
                            '<br><b>Subscribers: </b>'+this.x+
                            '<br><b>Hashtag Count: </b>'+this.y)}"))
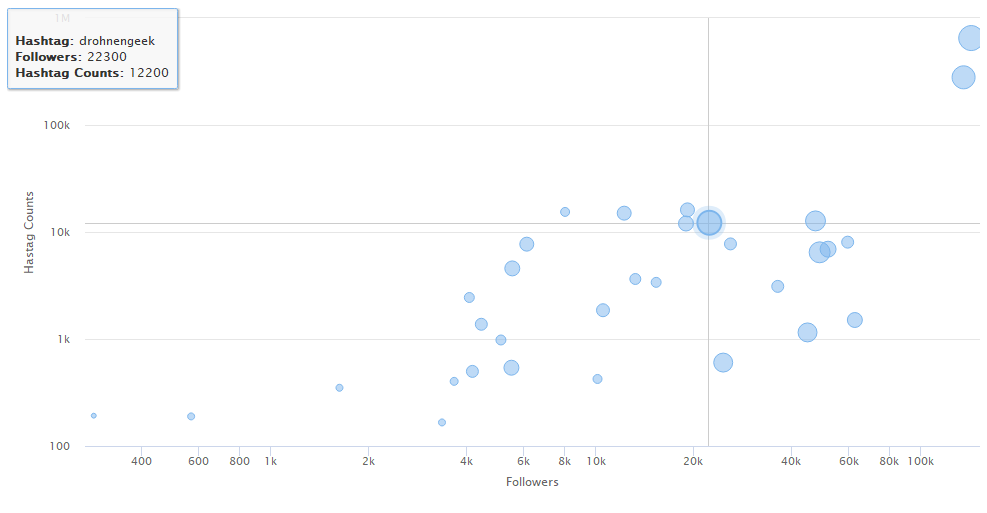
In this case, the interactive plot may be better because it is for interactive use and you don’t have to worry about overplotting. Here, I have plotted the number of followers for an account vs the number of public posts with this username. There is not much data points here (n=32), but we can see some trend showing that accounts with more followers are also hashtagged more. As an account becomes more popular with more followers, people tend to use that account name as hashtag more and more. We can also roughly see that accounts with more followers and more hashtag counts have more posts. This data fits our expectations. My guess for cases where data points deviate from this expectation is due to account holder deleting poorly performing posts.
This plot may help us in picking suitable hashtags. Hashtags with hundreds of thousands of posts can give your post more exposure but quickly gets displaced by incoming posts. Hashtags with few hundred posts may only cater to a niche handful of subscribers, but your post will stay around on the top for days or even weeks. I suppose the reasonable approach is to pick hashtags from across the board to maximise exposure for your content.
One can go further with this idea and gather more data (get more account names from diverse niches) and also categorise accounts into various groups, give them arbitrary rating etc and plot them out.
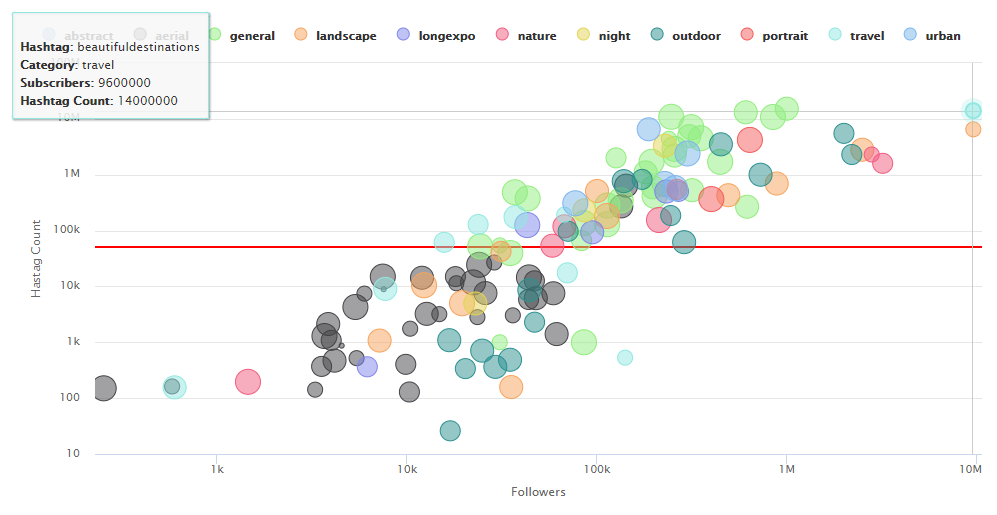
Here, there are lot more accounts and it becomes easier to visualise the linear relationship. I have coloured accounts into categories and the size of points denote my personal rating. Now I can also choose hashtags from category other than aerial that may be relevant to my content.
Of course, this is too simplistic and I don’t even know if this works, it’s just theory. There are numerous other factors which influences the organic reach of a post. I’ve even read that repeatedly using the same hashtags or using too many or too few hashtags are frowned upon by Instagram.


Comments