as_dag() is the entry point for any DAG that isn't read from a
targets pipeline (see tar_dag()). It normalizes the input into a
dag: a classed list with nodes and edges data frames, keeping
insertion order throughout, the way networkx does.
Usage
as_dag(x, ...)

# S3 method for class 'data.frame'
as_dag(x, nodes = NULL, ...)

# S3 method for class 'list'
as_dag(x, ...)

# Default S3 method
as_dag(x, ...)
Arguments
- x
An edge-list data frame with
fromandtocolumns, or alistwithverticesandedgeselements (the shapetargets::tar_network()returns; seetar_dag()). Any other columns of the edge-list data frame are kept as edge attributes; a numeric one can set the edges' width (edge_width, seeggplot_dag()).- ...
Passed on to methods.
- nodes
Optional data frame of nodes, with at least a
namecolumn, listed before any additional nodes implied only byx's endpoints. Its other columns are node attributes, but not namedrow,col,x,yorcolor_index: the layout uses those names for its own columns (seedag_layout()), so these names are reserved, and using one is an error.
Value
A dag: a classed list with nodes (columns name, label,
plus any extra attributes, which node_color, node_shape and, for a
numeric one, node_size can name) and edges (columns from, to,
plus any extra columns of x, which only edge_width uses for
drawing) data frames, in insertion order.
Details
as_dag.list() deliberately narrows the return value described above.
It is the tar_dag() path, so it keeps only the vertices columns a
metro plot can use - type, status, description, seconds,
bytes and branches - and no extra edges columns. To color by
other node attributes, pass an edge-list data frame and a nodes
table to as_dag.data.frame() instead.
Node names are identities, and the package matches edge colors on them
downstream, so every method rejects a name that is NA, empty
or contains "|" or a carriage return.
Examples
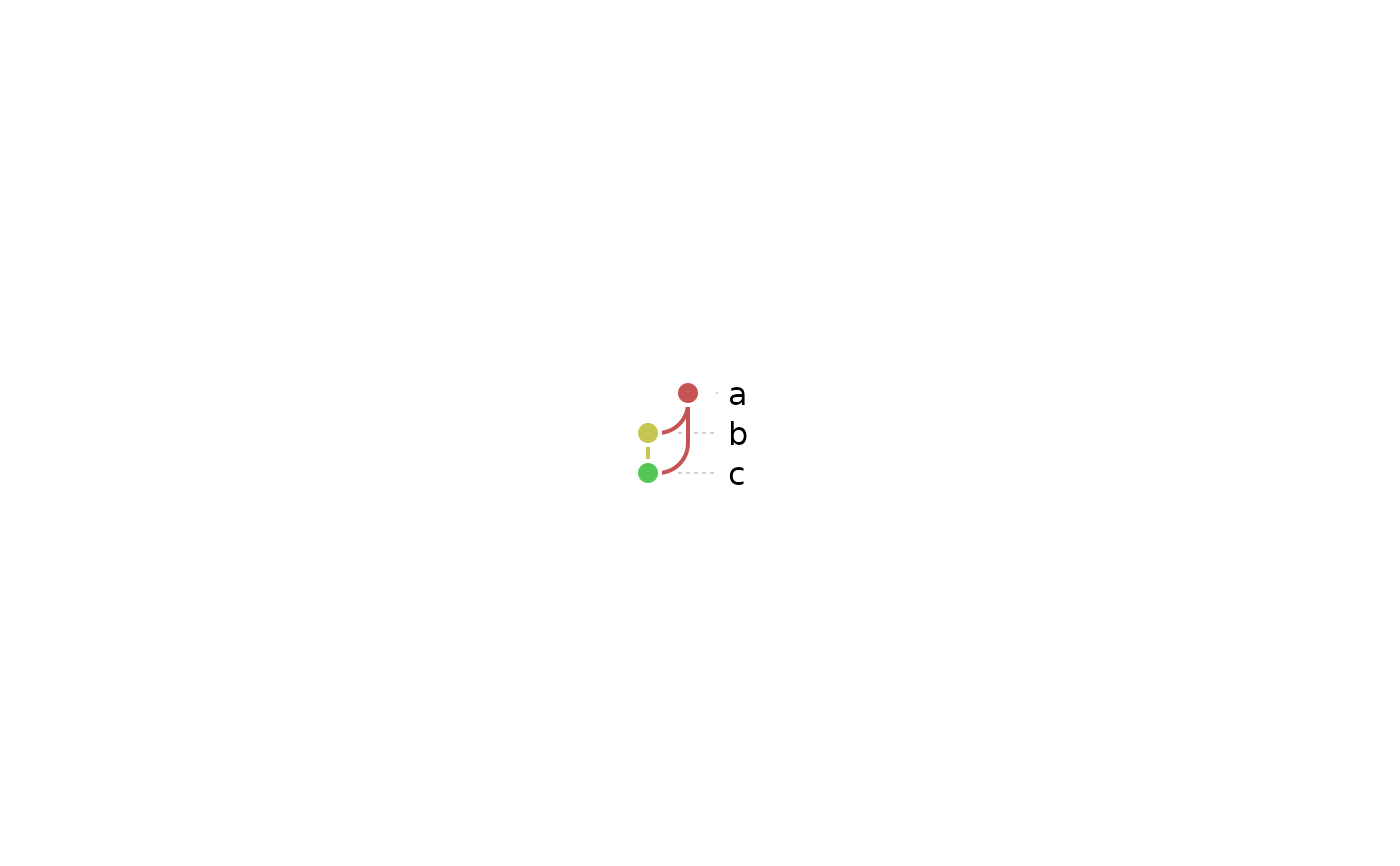
edges <- data.frame(from = c("a", "a", "b"), to = c("b", "c", "c"))
dag <- as_dag(edges)
print(dag)
#> <dag> 3 nodes, 3 edges
ggplot_dag(dag)
 # a node table, with extra attributes for coloring
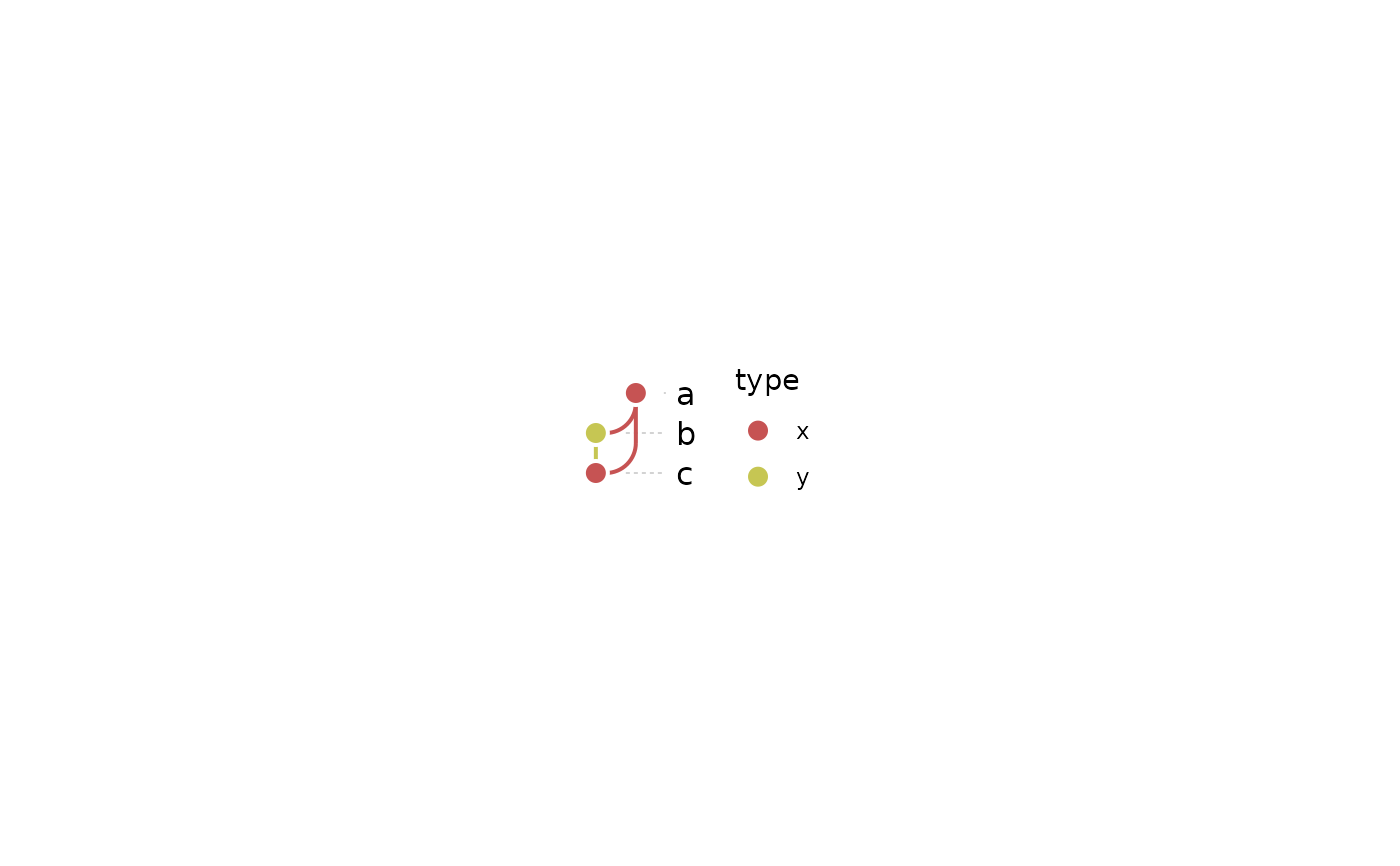
nodes <- data.frame(name = c("a", "b", "c"), type = c("x", "y", "x"))
dag2 <- as_dag(edges, nodes = nodes)
ggplot_dag(dag2, node_color = "type")