Collapses a dag: the nodes that share a value of the by column are
merged into one node, named after that value, and the edges are projected
onto these new nodes. A pipeline of fifty targets in four stages becomes a
graph of four nodes, drawn by the same functions (ggplot_dag(),
tar_ggplot()) as any other dag.
Value
A dag, with the columns described above: nodes name, label,
n and the rolled-up columns, and edges from, to and n.
Details
Any node column works as by, so there is nothing special about its name:
a column of your own (passed to as_dag() as nodes), or one that
tar_dag() returns - description, type or status. targets has no
tag or category field of its own, and description is its one free-form
text, so a pipeline's stages go there: see "Collapsing a pipeline by
stage" in tar_ggplot(). For any other metadata, add a column to
dag$nodes yourself first (not named row, col, x, y or
color_index).
A node with no value in by (NA or an empty string) stays on its own,
and a value that is also the name of such a node is an error, since the
two would be merged.
Nodes.
nameis the value ofby, andlabelis that value with the member count,"model (7)". A node with nobyvalue is not merged: it stays as it is, in its own place. The order is the order of first appearance, so each merged node sits where its first member was.ncounts the members (replacing anyncolumn you already have, sonitself is not a usefulby).Other node columns.
seconds,bytesandbranchesare summed (NAif every member isNA). Any other column keeps its value when all the members share it, and isNAotherwise; in particular thebycolumn itself keeps its value (even if it is one of the columns that are otherwise summed), sonode_color = bycolors the collapsed graph.Edges. An edge between two members of one group disappears. The others are drawn between the groups, once per pair of groups, with an
ncolumn that counts the edges it stands for. Any other edge column is dropped.
Merging nodes can create a cycle, which a DAG can't have: with a -> b -> c, a and c in group X and b in group Y, the collapsed graph has X -> Y -> X. That is an error, naming the groups and the edges behind it. Group
by a different column, or move the node that closes the loop.
Examples
nodes <- data.frame(
name = c("raw", "clean", "fit", "eval", "report"),
stage = c("data", "data", "model", "model", "report")
)
edges <- data.frame(
from = c("raw", "clean", "fit", "eval"),
to = c("clean", "fit", "eval", "report")
)
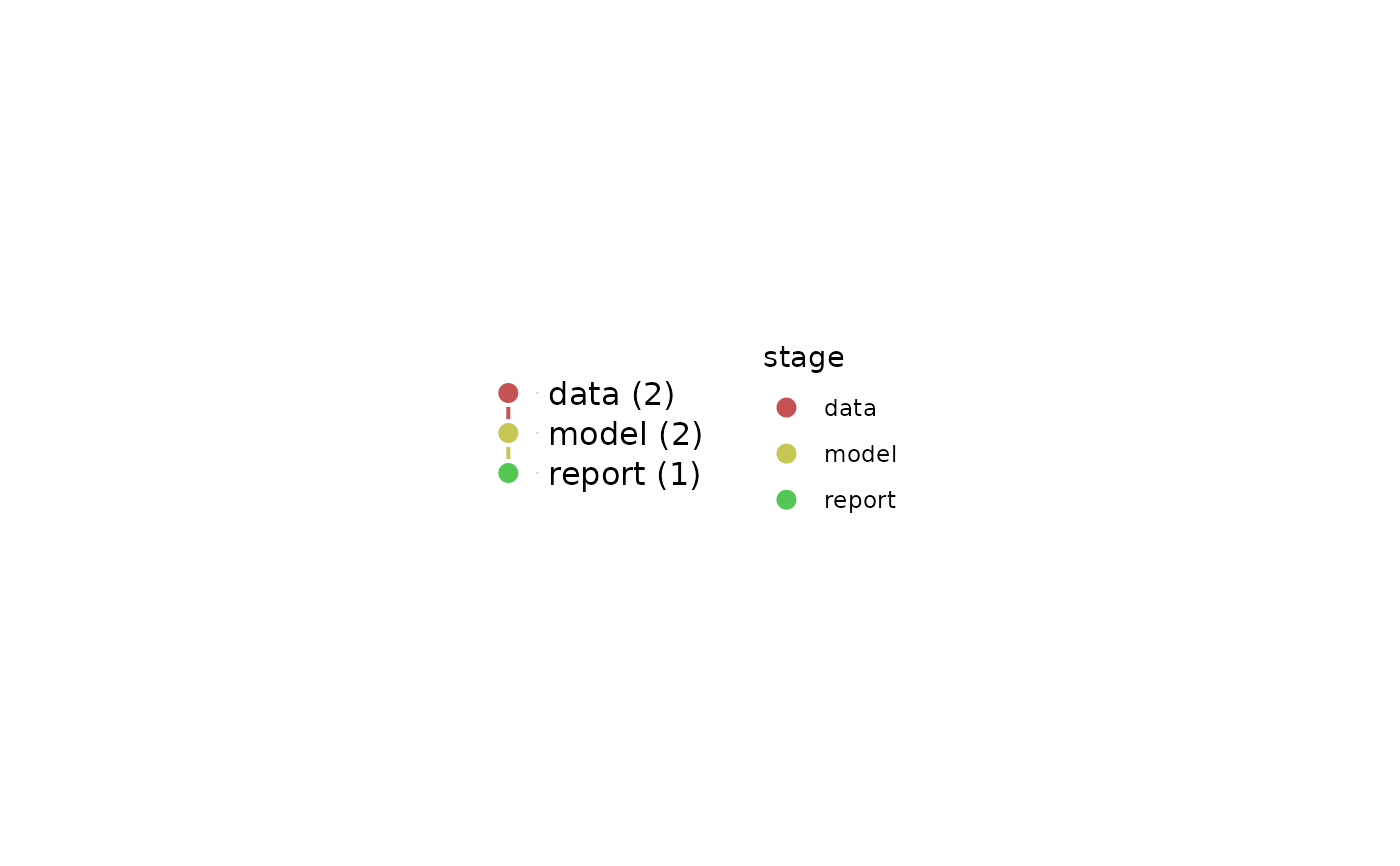
dag <- as_dag(edges, nodes = nodes)
small <- dag_collapse(dag, "stage")
small$nodes
#> name label stage n
#> 1 data data (2) data 2
#> 2 model model (2) model 2
#> 3 report report (1) report 1
small$edges
#> from to n
#> 1 data model 1
#> 2 model report 1
ggplot_dag(small, node_color = "stage")
 # a grouping that closes a loop is an error
bad <- as_dag(
data.frame(from = c("a", "b"), to = c("b", "c")),
nodes = data.frame(name = c("a", "b", "c"), group = c("X", "Y", "X"))
)
try(dag_collapse(bad, "group"))
#> Error : dag_collapse(): collapsing by `group` creates a cycle: X -> Y -> X
#> Through these edges:
#> X -> Y: a -> b
#> Y -> X: b -> c
# the targets' own `description` as the key
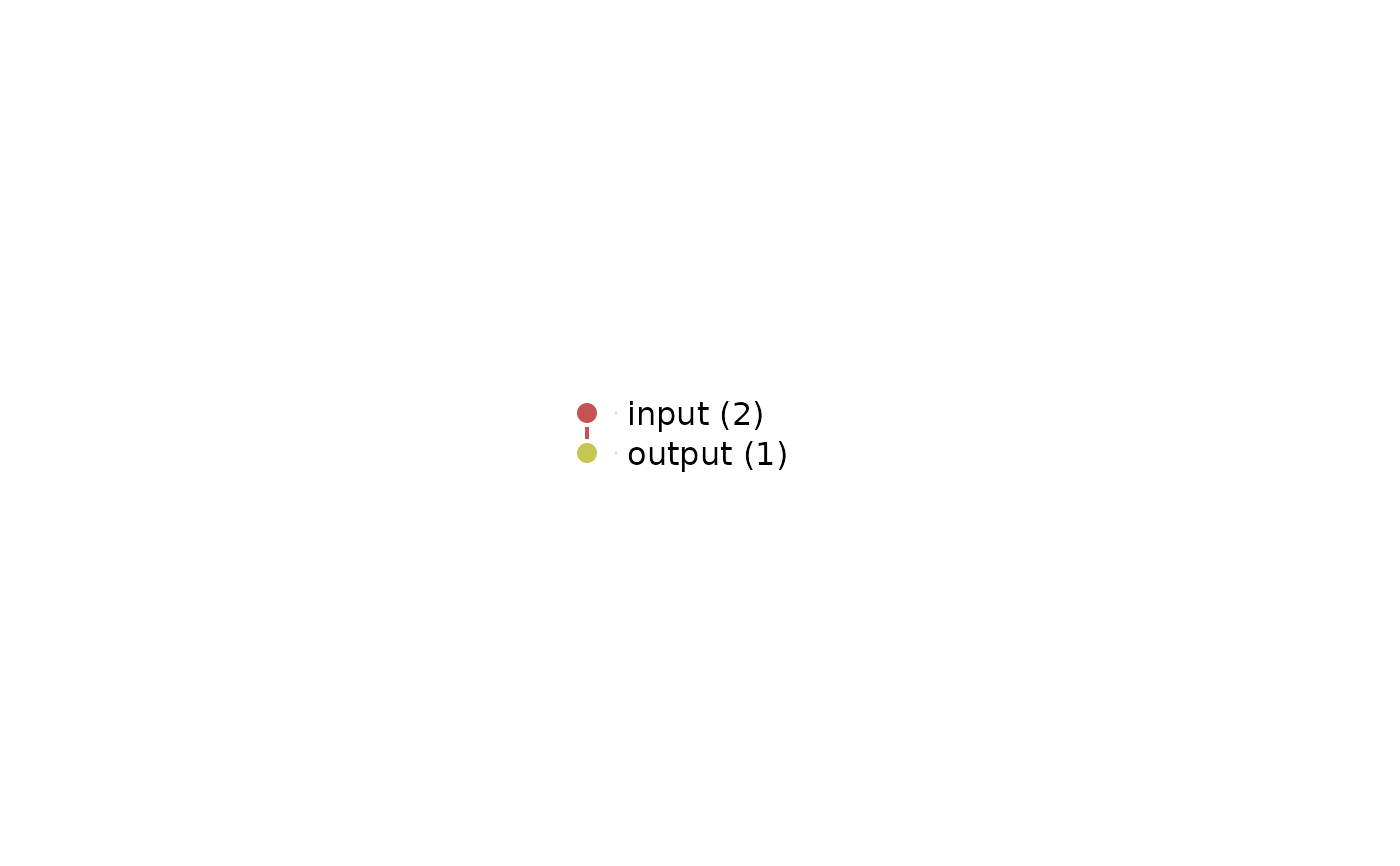
targets::tar_dir({
targets::tar_script(list(
targets::tar_target(x, 1, description = "input"),
targets::tar_target(y, x + 1, description = "input"),
targets::tar_target(z, y * 2, description = "output")
))
ggplot_dag(dag_collapse(tar_dag(), "description"))
})