Returns a list of ggplot2 layers in draw order, ready to add to a
ggplot() call (or combined with dag_theme() by ggplot_dag()).
Usage
dag_layers(
  layout,
  node_color = NULL,
  edge_color = "source",
  palette = metro_palette,
  node_shape = NULL,
  shapes = targets_node_shapes(),
  node_size = NULL,
  edge_width = NULL,
  zoom = 1
)
Arguments
- layout
A
dag_layout, as returned bydag_layout().- node_color, palette, edge_color
Color resolution arguments: see the pkgdown site's Colors article for the full set of rules and examples.
palettemust supply at least one color per node (or per distinct value of anode_colorcolumn); colors are never recycled, and the defaultmetro_palette()never repeats one.palette = NULLis the same as the default,metro_palette().- node_shape
The shape of a node:
NULL(the default), a node column name, or a single shape name. A shape is"circle","square","diamond","triangle"or"triangle_down".NULLfollows the nodes'typecolumn if they have one (as a pipeline fromtar_dag()does), and otherwise draws circles; atypevalue thatshapesdoesn't name is a circle. A column name maps that column to shapes and warns about valuesshapesdoesn't name; a shape name draws every node as that shape. A legend names the shapes whenever more than one is drawn; withnode_colorset to the same column, it is merged with the color legend. Remove it with+ ggplot2::guides(shape = "none").- shapes
Which shape each value of the
node_shapecolumn gets: a named character vector (value -> shape), or an unnamed one of shapes assigned to the distinct values in order, which must supply at least one per value. Defaults totargets_node_shapes().- node_size
The size of a node:
NULL(the default, every node has the radiusnode_radius), or the name of a numeric node column, such as thenthatdag_collapse()adds (orsecondsorbytesof a pipeline fromtar_dag()). The radius follows the square root of the value's position between the smallest and the largest value, over thenode_size_rangeofstyle_metro(), so that it is about the node's area that grows in step with the value. A node with anNAvalue has the radiusnode_radius. There is no legend for the size: for a collapsed graph, the labels carry the count. The largest radius a circle may have keeps it inside the grid, but a triangle or diamond reaches further (seenode_radiusofstyle_metro()), so with anode_shapeof those, the biggest ones in the first or last row, or the left column, may be cut off: raisescale. Two of the biggest nodes in neighboring rows leave almost no room for the line between them: seenode_size_rangeofstyle_metro().- edge_width
The width of an edge:
NULL(the default, every edge isedge_stroke_widthwide), or the name of a numeric column of thedag'sedges, such as thenofdag_collapse(). The width grows linearly with the value, over theedge_width_rangeofstyle_metro(). An edge with anNAvalue isedge_stroke_width. In this metro layout the edges from one node share a line, and so do those entering one node from the same side, so a shared line is as wide as the widest edge it carries. Each edge is then drawn whole (as for anyedge_colorbut"source"), the widest first, so that the narrower ones stay visible on top; and each bridge is wide enough for the widest edge drawn over it.- zoom
Multiplier for node size, line widths and text size, to match a panel sized at
zoompx per data unit (seeggplot_dag()).
Examples
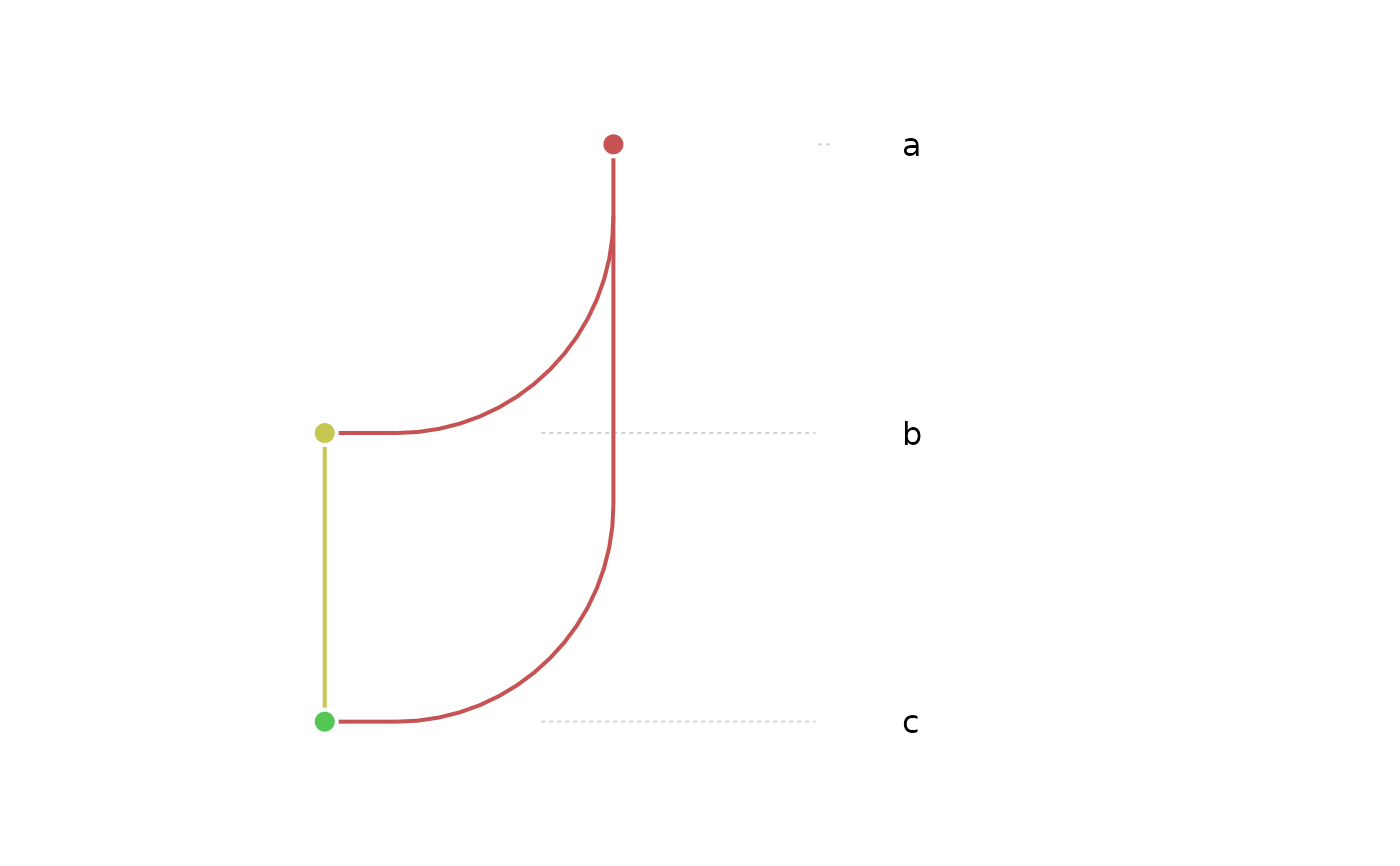
dag <- as_dag(data.frame(from = c("a", "a", "b"), to = c("b", "c", "c")))
lay <- dag_layout(dag, style_metro())
ggplot2::ggplot() + dag_layers(lay) + dag_theme()